Growth Report
District leaders often rely on periodic standardized tests to measure student learning. This long-standing model provides key benchmarks but leaves gaps between testing cycles.
I led the design of a dynamic report that translates continuous learning data into a clear, actionable experience for administrators. The report became the most-used feature in DreamBox's admin dashboard, helping leaders identify student growth patterns and opportunities. Many admins have since brought the report to key educational board meetings, citing its impact and advocating for continued investment in DreamBox.
my role – strategy and vision, UXR, UX/UI
my focus – evidence-based strategy, research-driven design, simplifying the complex, data visualization
the team – PM, UXR lead, engineering, internal SMEs
a bit of context
DreamBox Math is an adaptive, game-based math product that continuously assesses students' skills as they play. This generates a rich stream of ongoing student learning data. While the platform captures this detailed student growth data, district leaders didn’t have a clear way to access or act on it.
Challenge: Administrators lack visibility into student progress between formal test cycles, in a format that aligns with their timeline and goal of driving student learning.
Solution: Develop a new report that will turn raw, continuous data into digestible insights that district leaders can trust and act on to achieve their goals:
- Clearly shows continuous student progress over time
- Highlights patterns that inform where to celebrate or intervene, where needed
- Demonstrates DreamBox’s value and return on investment
In the wake of pandemic-related learning loss, educational leaders needed a clear view of where students were in their learning journey, what gains were being made, and where support was most needed.
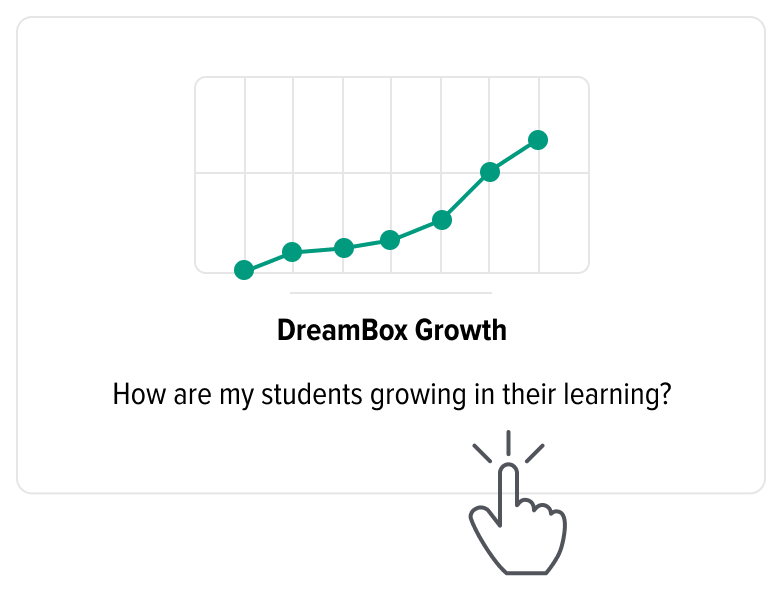
Enter: The Growth Report.
research, research, research
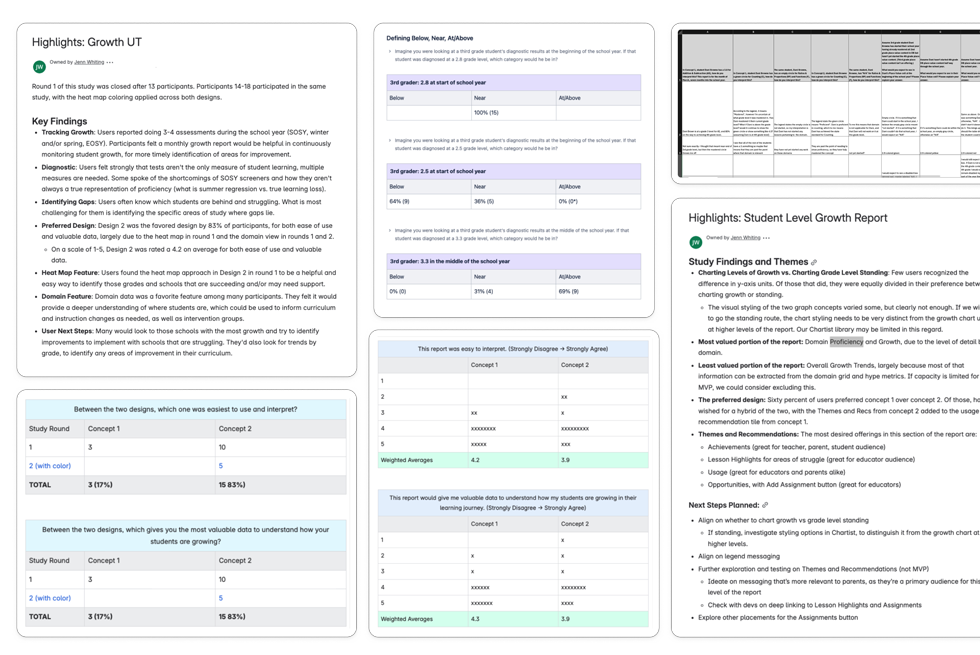
Over the course of the project, I led or contributed to several research studies that included moderated interviews, unmoderated usability tests, and internal reviews with former administrators. This gave us a deep and evolving understanding of what admins needed from growth reporting:
- Growth measures relative to grade-level standing: Growth can occur at any level, are students growing at, near, or above their rostered grade level
- Easy identification of their high-flying vs low-performing schools and grade bands
- A view across and within all curriculum domains, not just best and worst
- Contextual data showing how product usage influences growth
- The ability to track growth trends over time, not just point-in-time comparisons
For each research study, I synthesized the feedback and shared my findings with PM, data, and dev leads to refine the data and dev requirements.
design evolution
Research revealed new insights into admin goals and uncovered additional data opportunities. Throughout design, I balanced user and business goals, dev constraints and timelines, as well as rich data with report clarity.
As the Growth Report evolved into a layered, yet intuitive, insight-rich experience:
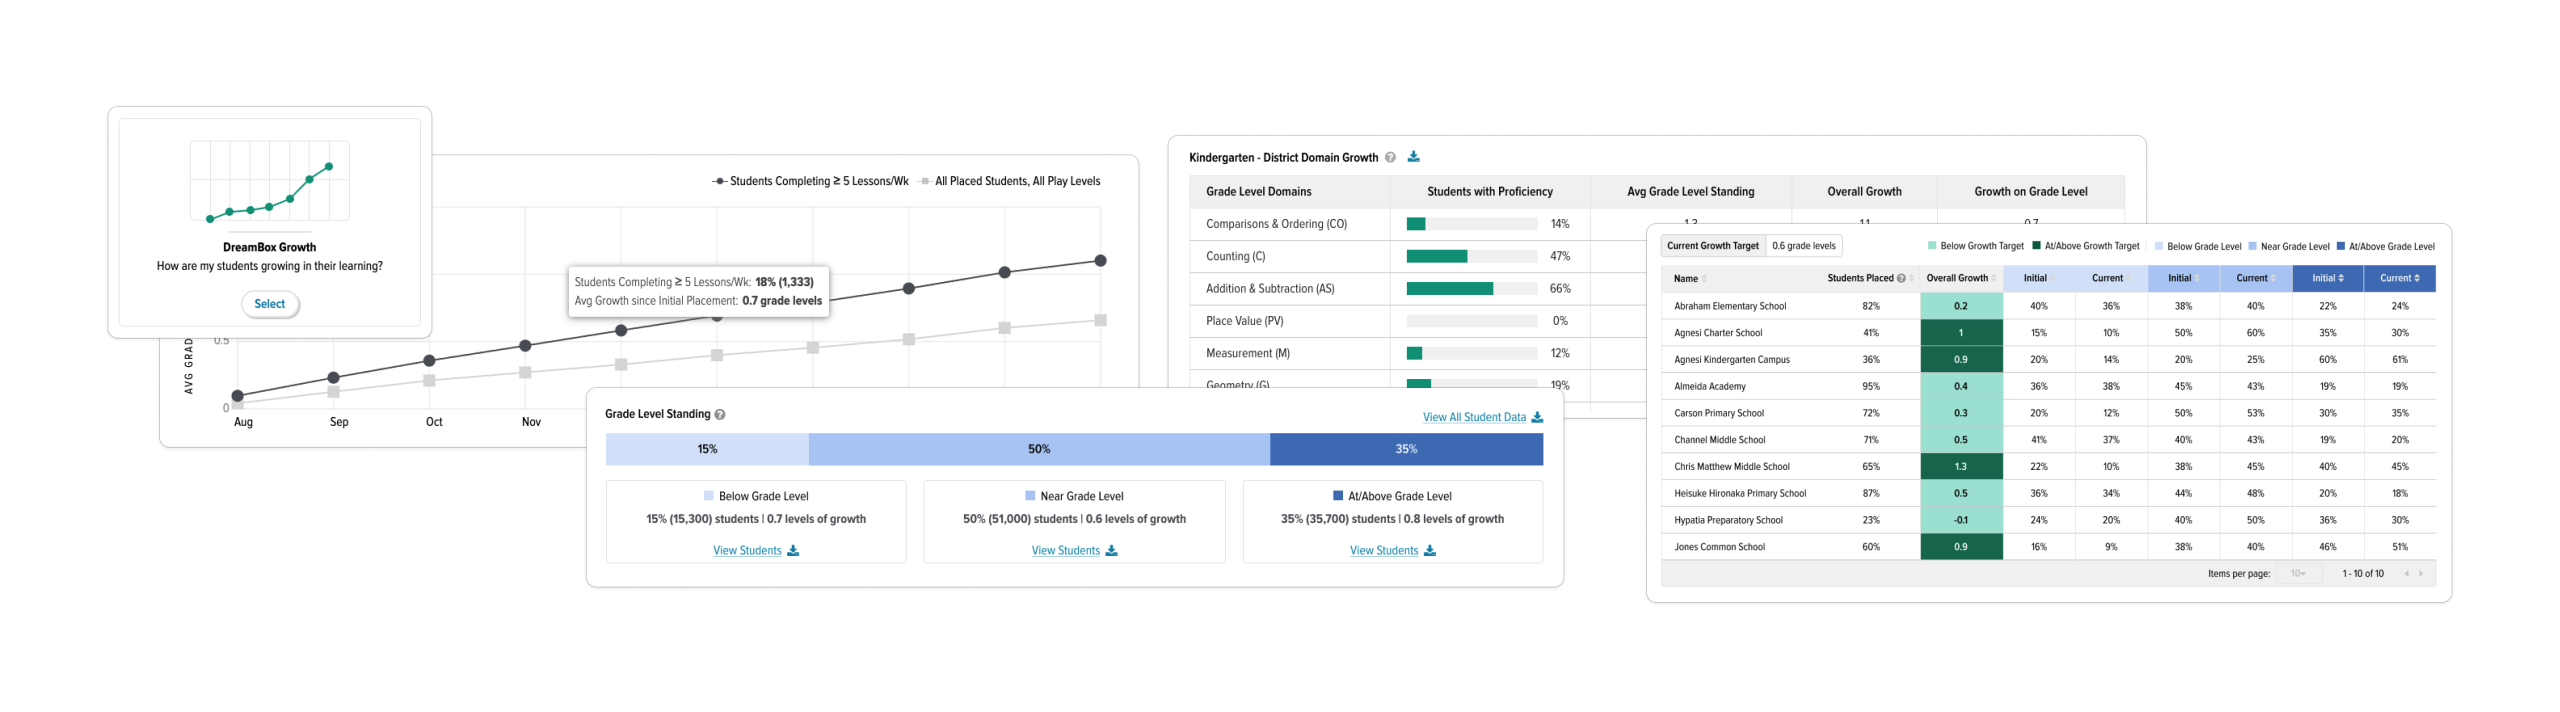
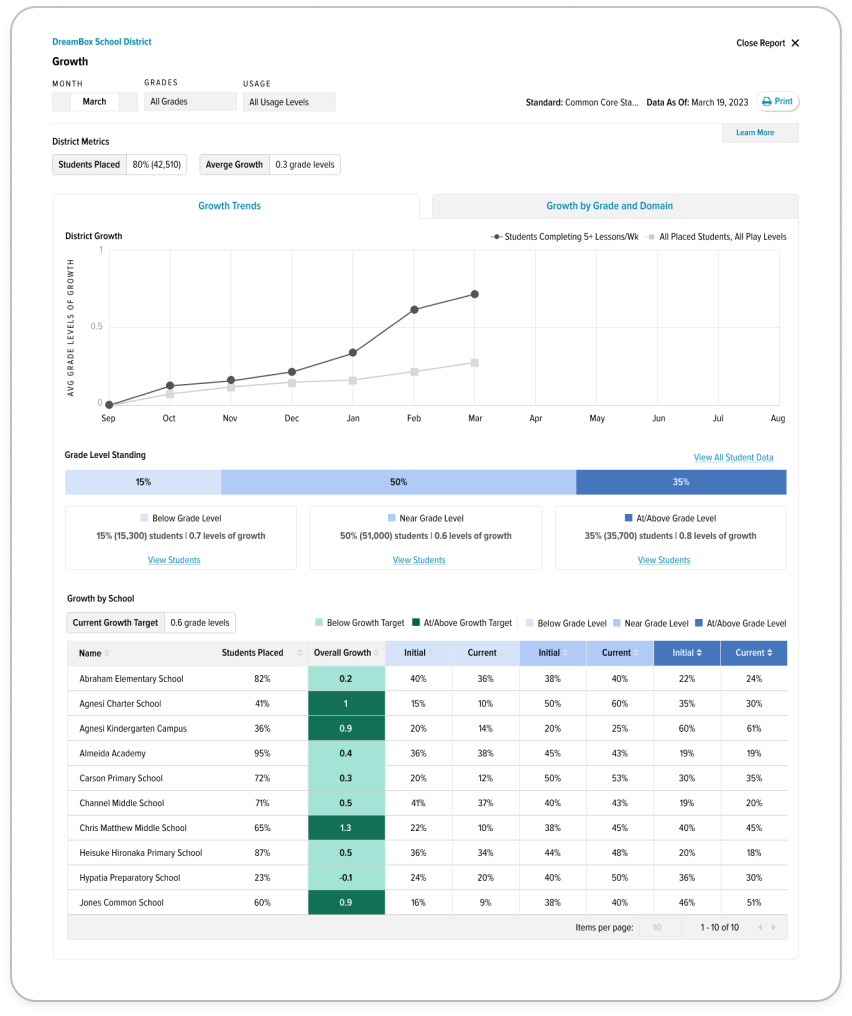
- I introduced a heat map to help leaders quickly scan growth across schools, highlighting both bright spots and areas that may need attention.
- I overlaid usage data on the line graph to shed light on low growth instances that were due to low product engagement
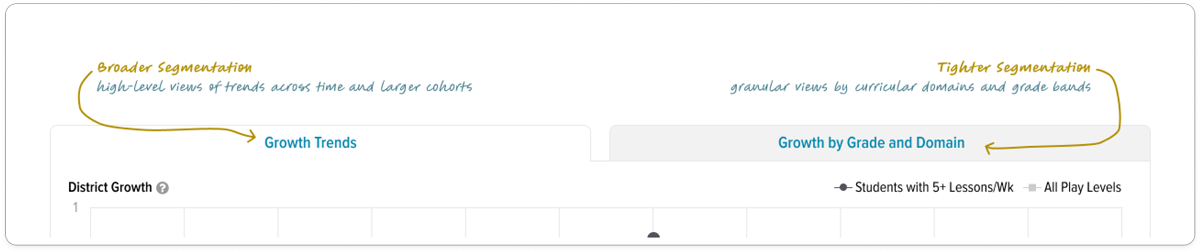
- I experimented with multiple layout directions, from modular mini-reports to designs in a choose-your-own-adventure style, before settling on a two-tab experience:
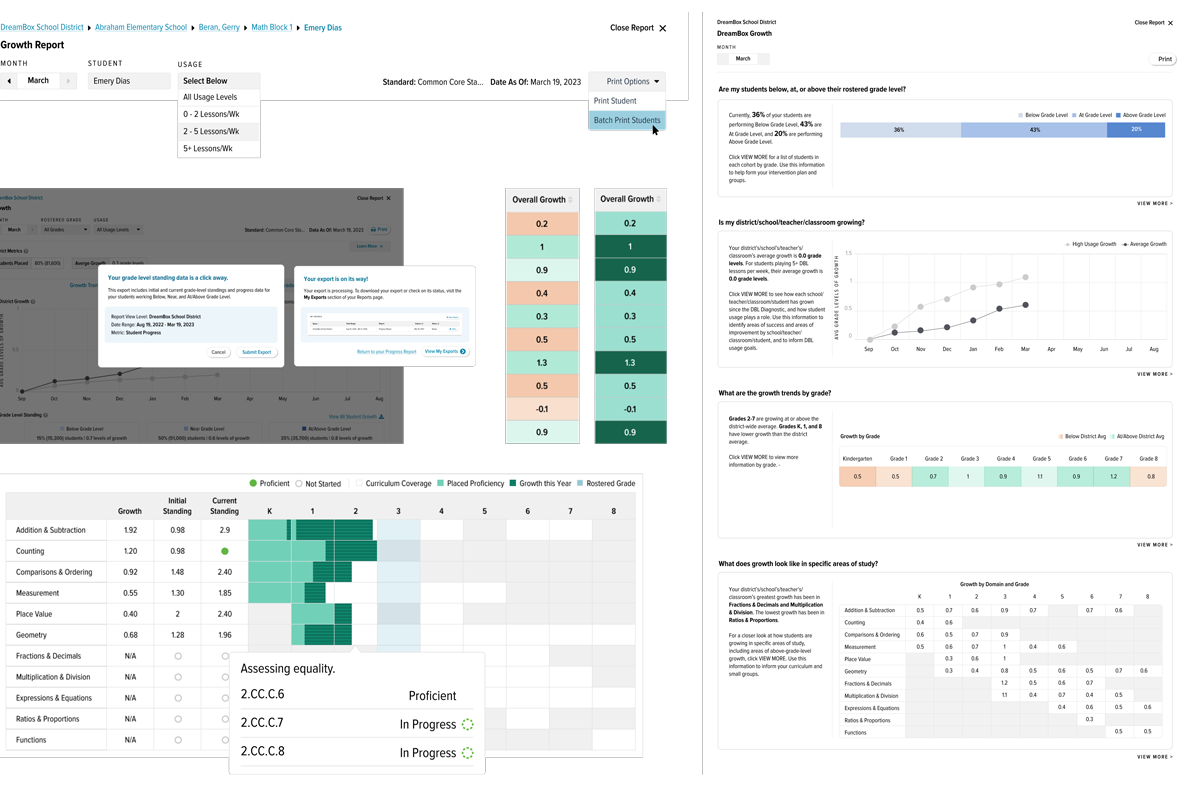
- Tab 1 showed high-level trends over time and relative to rostered grade levels
- Tab 2 offered more granular views by curricular domains and grade bands
early feedback program (EFP)
To validate value as development on later milestones continued, we rolled the Growth Report out in a staged Early Feedback Program (EFP). A select group of district leaders used the report live with their own data, offering valuable insight into usability and opportunities for improvement. Their feedback directly shaped our general release of MVP.
In response to the EFP, I:
- Added a usage filter to further illustrate how student usage correlated with learning gains
- Adjusted the heat map logic and presentation to address confusion
- Introduced multi-select filters for school and grade views
- Included export and print options so reports could be shared with boards and caregivers
- Planned future expansion to the teacher experience, allowing educators to monitor classroom and student-level growth
outcome and impact
Following general release, user feedback has been overwhelmingly positive and the Growth Report has become the most-used feature in the admin dashboard.
Some district leaders have even cited the Growth Report in presentations to state boards, using it as evidence of student progress and to advocate for continued investment in DreamBox.
In a crowded edtech landscape, this kind of support reflects the meaningful value the Growth Report and the DreamBox student experience offer educators and students.
reflections
This project was a clear reminder that users don’t want more data, they want the right data, surfaced at the right time, and in a way that is easily understood and acted upon in support of their goals.
By grounding our work in research and testing at every phase, we empowered admins to not only support their students but to further advocate for continued and wider adoption of our product. The ripple effects of committing to research and data-driven design can be truly powerful, for users and business alike.